Macro Compass
Know what institutions are doing before you pick a direction.
Start Free Trial →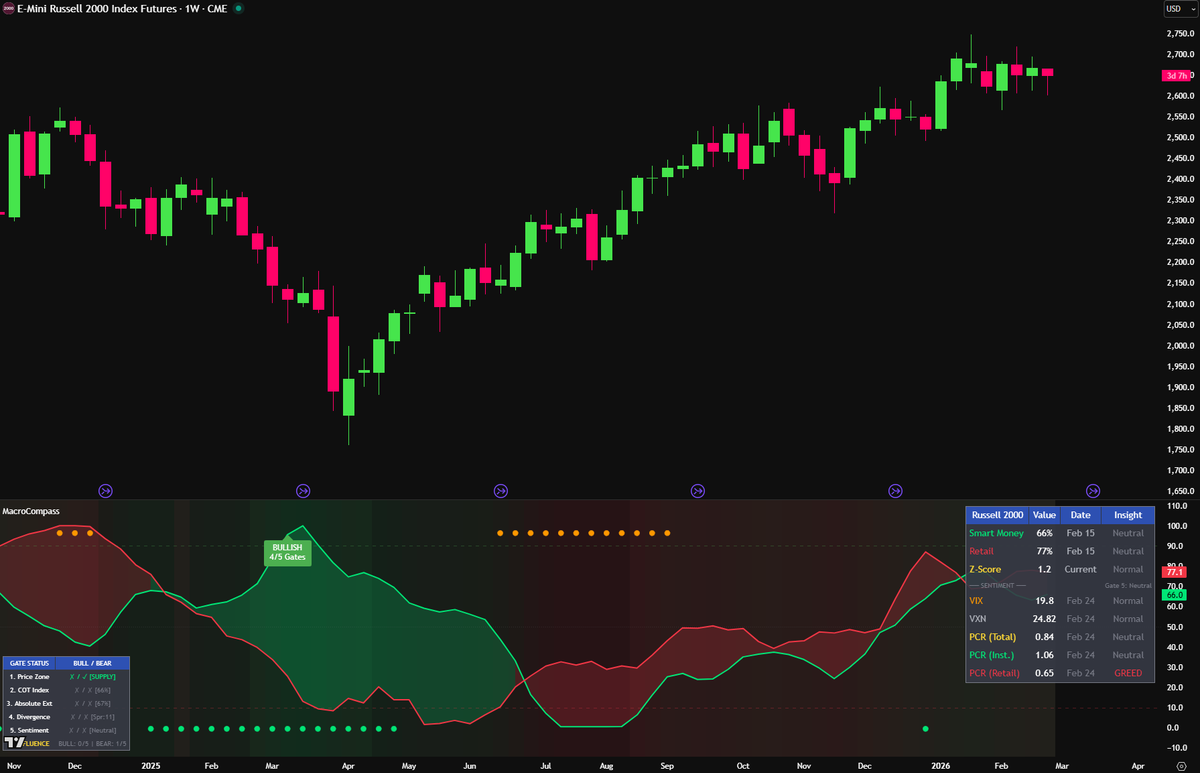
Hypothetical example for illustration only. Not a trade recommendation. Past signals do not guarantee future results.
Overview
What It Does
Macro Compass combines Commitment of Traders (COT) data, Put/Call Ratios, and volatility indices (VIX) into a single sentiment dashboard with a proprietary Five-Gate Signal System. Unlike simple COT indicators that just display positioning data, signals only fire when multiple uncorrelated conditions align. The indicator automatically adapts its analysis based on asset class, using the appropriate COT report type and contrarian metric for each market. Built for swing traders and options players who want macro context before entering any trade.
Capabilities
Key Features
Five-Gate Signal System
Signals require 3–5 independent gates to align before firing. Gate 1: Price at 52-week extreme range. Gate 2: COT Index at historical extreme. Gate 3: Absolute positioning at multi-year extreme. Gate 4: Smart Money vs. Contrarian divergence. Gate 5: PCR + VIX sentiment confirmation. More gates = higher conviction.
Automatic Asset Adaptation
Automatically selects the correct COT report type and contrarian metric for each market — equities, commodities, currencies. No manual configuration needed.
Sentiment Dashboard
Visual table showing COT positioning, PCR levels, VIX regime, and gate status at a glance. Color-coded bullish/bearish/neutral.
Weekly Signal Cadence
COT data releases weekly (Friday for previous Tuesday). Designed for weekly decision-making — check it once and set your directional bias for the week.
Process
How It Works
Select your symbol
Macro Compass auto-detects the asset class and loads the correct COT data for equities, commodities, or currencies.
Five-Gate system evaluates
The indicator evaluates institutional positioning, sentiment extremes, and contrarian divergence across all five gates independently.
Signal fires when 3+ gates align
When 3 or more gates align, a directional signal fires (Bullish or Bearish) with the gate count shown so you know conviction level.
Use as macro bias
Use the signal as your weekly directional bias — then switch to Formation Scanner or your chart for entry timing.
Workflow
Works With
Pairs well with these other TDL indicators.
Get Started
Get Macro Compass
Not financial advice. Educational purposes only. This indicator generates signals based on historical data and mathematical calculations. Results shown are hypothetical and for illustration purposes only. Past performance does not guarantee future results. Trading involves substantial risk of loss and is not suitable for every investor. All trading decisions are your own responsibility.