Delta Flow Pro
See who's actually in control — on every candle.
Start Free Trial →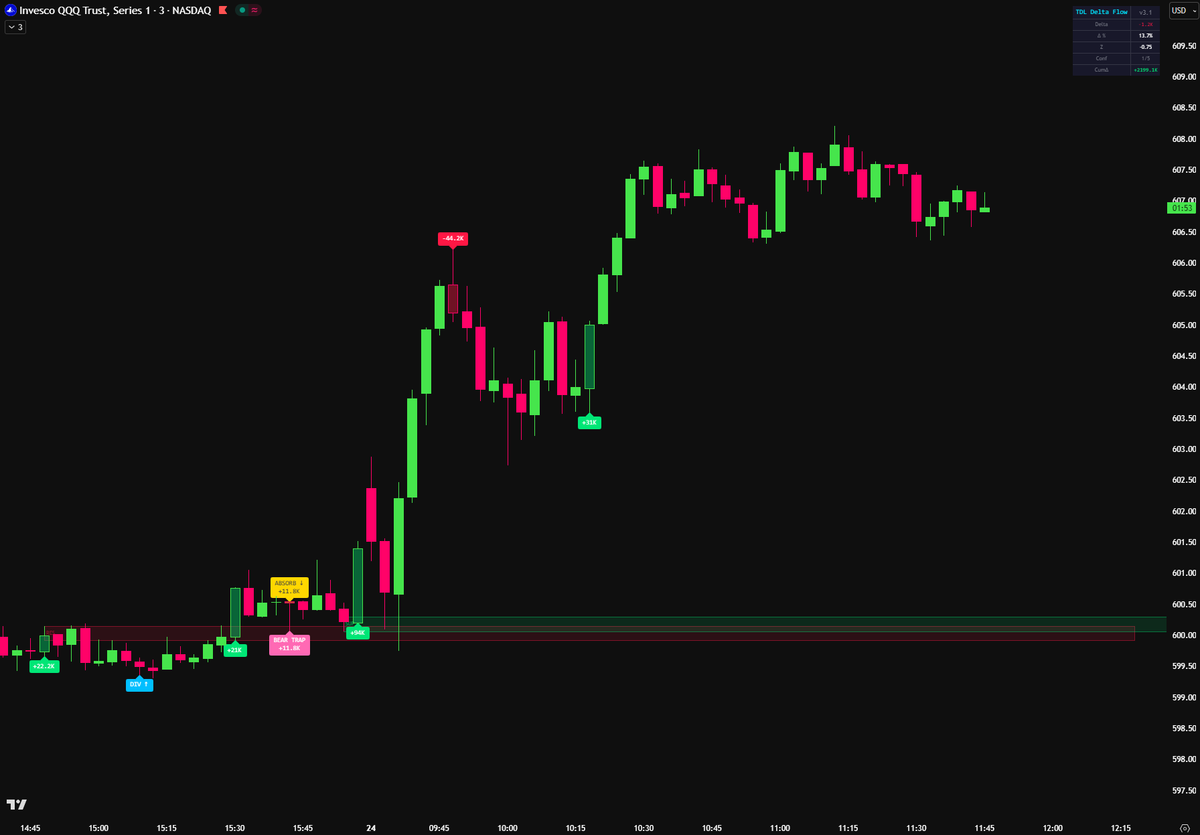
Hypothetical example for illustration only. Not a trade recommendation. Past signals do not guarantee future results.
Overview
What It Does
Estimates real-time volume delta from lower-timeframe candle data, decomposing each bar into buy volume versus sell volume. Unlike basic volume indicators that only show total volume, Delta Flow reveals directional flow beneath the surface. A green candle with negative delta = sellers dominated despite price closing up — a potential trap. Now includes DepthFlow Zones — automatically maps session supply and demand zones based on where volume concentrated during the day. See exactly where institutional activity was heaviest, with confirmation signals when price returns to those levels. Works on futures and stocks. Designed for futures and active equity traders who need order-flow context that price alone doesn't provide.
Capabilities
Key Features
DepthFlow Zones — NEW
Automatically maps session supply and demand zones based on where volume concentrated during the day. See exactly where institutional activity was heaviest, with confirmation signals when price returns to those levels. Works on futures and stocks.
Real-Time Delta Decomposition
Breaks each bar into buy vs. sell volume using lower-timeframe data. See the actual directional pressure happening underneath every candle.
Absorption Detection
Identifies bars where large delta was fully absorbed by a hidden counterparty — reveals institutional activity that price movement alone doesn't show.
Sequential Trap Detection
Spots multi-bar trap sequences where consecutive bars show directional price movement contradicted by delta. Spots volume delta divergences and absorption patterns in real time.
Cumulative Divergence
Tracks when cumulative delta diverges from price direction — a structural warning sign of potential reversal. Price making higher highs while delta makes lower highs is a red flag.
1–5 Confluence Score
Each signal gets a confluence score (1–5). Higher scores = more delta factors aligning simultaneously. Use score to filter and prioritize signals.
Adaptive Thresholds
Session-aware thresholds that account for opening drive vs. midday vs. closing action. No static levels that break down in different parts of the trading day.
Process
How It Works
Add to your chart
Delta bars appear below price, color-coded by buy/sell dominance. The indicator begins processing lower-timeframe data immediately.
Watch for absorption and trap signals
Absorption and trap signals are marked directly on the chart. These indicate moments where price action is potentially misleading about true directional control.
Check cumulative divergence
Monitor the cumulative delta line for divergence from price. When they separate, it's a structural warning — not a trigger, but a reason to be cautious.
Filter by confluence score
Higher confluence scores (4–5) indicate multiple delta factors aligning. Focus on these over lower-scored signals for higher-quality setups.
Demo Video
See It In Action
Workflow
Works With
Pairs well with these other TDL indicators.
Get Started
Get Delta Flow Pro
Not financial advice. Educational purposes only. This indicator generates signals based on historical data and mathematical calculations. Results shown are hypothetical and for illustration purposes only. Past performance does not guarantee future results. Trading involves substantial risk of loss and is not suitable for every investor. All trading decisions are your own responsibility.